

Back to top
mRNA Sequencing for Differential Gene Expression Analysis

-
Compare gene expression profiles obtained under different conditions
-
Study genetic profiles from transcript to pathway level
Overview
Considerations before starting an mRNA Sequencing project:
- Scientific objective
- Starting material & desired Services (Isolation to Bioinformatics)
- Organism and RNA fraction (Poly(A) enrichment, ribo depletion)
- Available data (model organism, reference genome)
- Sequencing depth (sensitivity)
- Replicates (confidence)
- Sequencing length (specificity)
- Sample amounts (complexity)
- Experimental setup (amount of samples , replicates, conditions to compare)
Let us guide you – from design to analysis
Example projects using mRNA Sequencing:
- Functional protein and pathway studies
- Disease caused gene expression changes
- Loss, gain and rescue of function experiments
- Part of an omics charcterization
- Functional changes due to species interactions
- Discovery of new genes or non coding regulatory RNA
- RNA variant detections
- Drug testing
Applications related to mRNA Sequencing:
- Shotgun metatranscriptomics
- Small RNA sequencing
Workflow
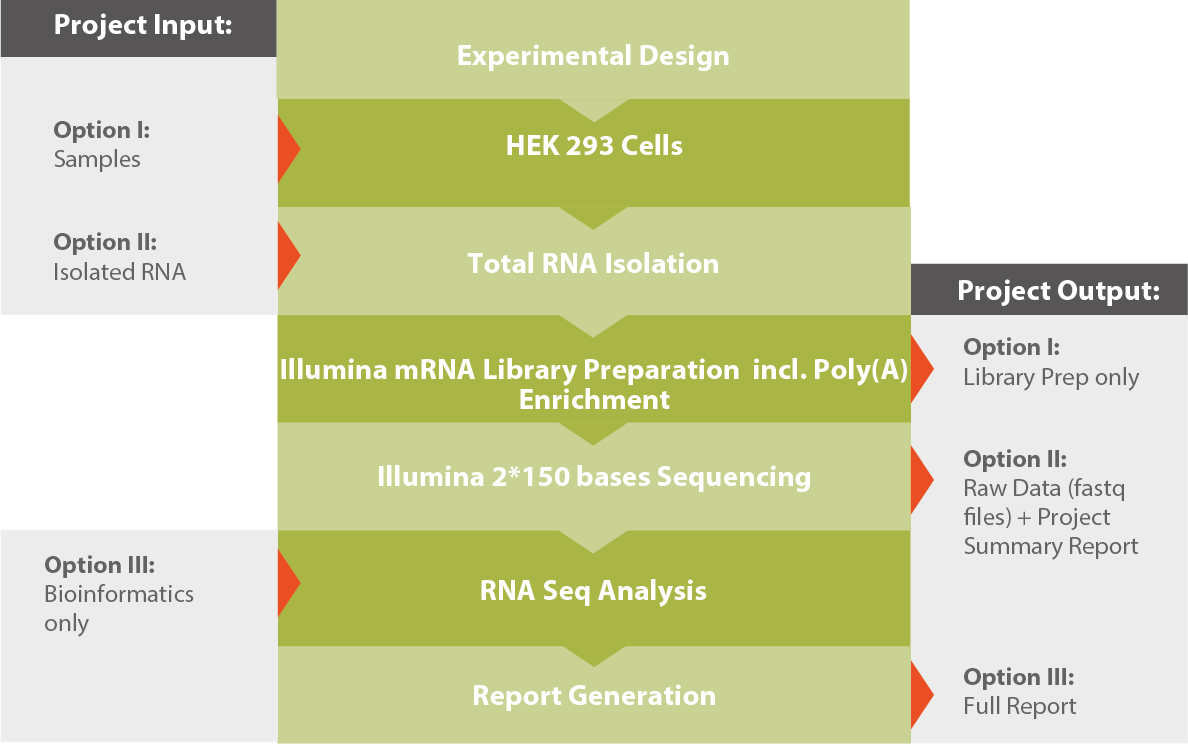
For further reading and a detailed technical description, please download our Application Note Illumina RNA Sequencing (see related downloads).
Results
Without Bioinformatics
Raw data
If no bioinformatics analysis module is ordered, Microsynth provides for mRNA sequencing the key outcomes as listed below:
- Assessment of Sequencing Quantity and Quality (in .xlsx format)
Evaluate the quantity and quality of sequencing data. - Raw data ( per sample, in .fastq format)
Access raw data for custom analysis or reference. - A Project summary report (.pdf format)
Summarize key project parameters.
With Bioinformatics
Standard Bioinformatic Analysis
For our mRNA sequencing application, Microsynth's module delivers a multitude of insights, addressing your scientific objectives:
Expression Analysis:
- Comprehensive Report (interactive .html format)
Delve deeper into data, sort, and filter results interactively. - Alignment/Map Files and Indexes (in .bam and .bai format)
Access alignment/map files along with corresponding indexes to trace every single read down to the reference genome. - Read Counts to Annotated Features (in .tsv format)
Obtain read counts mapped to annotated features such as genes or transcripts for quantitative in-depth analysis. - Visualization of Statistical Analysis (e.g. in .png Format, see Figure 1-5)
Access visually informative representations of statistical analyses, including volcano plots, heatmaps, enriched pathways, and exon maps.
Exclusive to Eukaryotic Transcriptomes:
- Differential Gene Expression Analysis (in .tsv and interactive .html Format, see Figure 3)
Explore differential gene expression with comprehensive results in both tabular and HTML formats. - Geneset Analysis (in .tsv and .html Format, see Figure 4)
Discover enriched pathways through geneset analysis, available in tabular and HTML formats. - Differential Exon Usage Analysis (in .tsv and .html Format, see Figure 5)
Delve into alternative splicing through differential exon usage analysis, with results provided in both tabular and HTML formats.
These deliverables provide actionable data from your mRNA sequencing analysis, enabling insightful decision-making.
Complementary Bioinformatic Analysis (at additional costs)
- Variant Calling of SNVs and Small (<50bp) InDels in the Transcriptome (in .vcf format)
Identify single nucleotide variants (SNVs) and small insertions/deletions (InDels) in the transcriptome with variant calling results provided in .vcf Format.
Given the appropriate experimental setup and the availability of relevant public data, these additional services offer a more profound understanding of your samples.
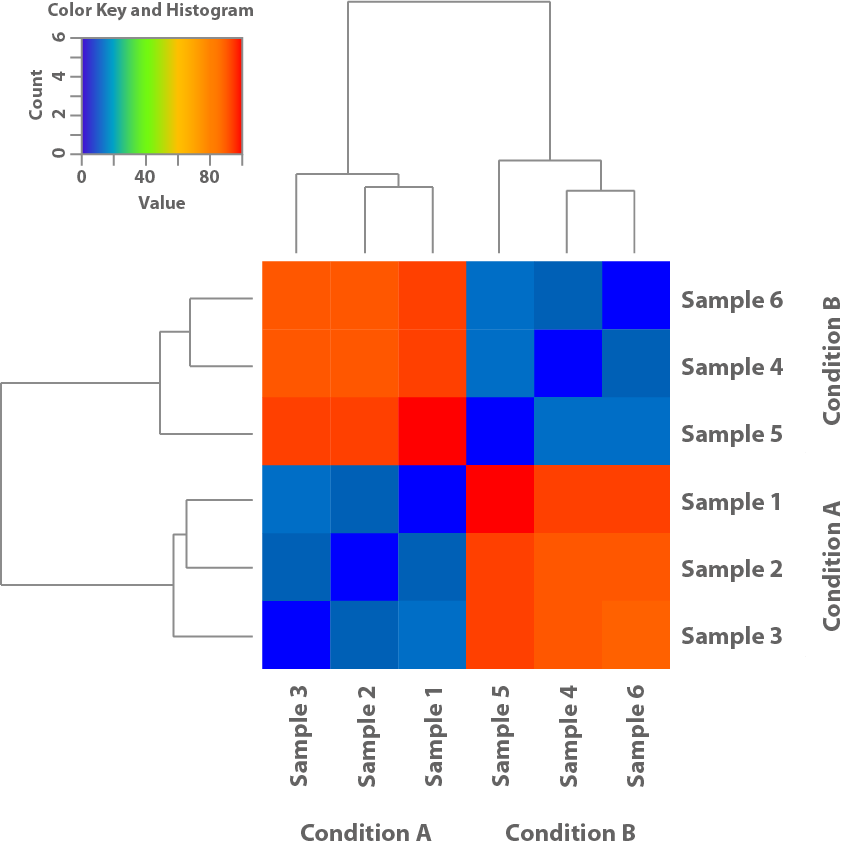
Figure 1: This heatmap is based on the expression patterns of the samples and shows their similarity to each other. Thus helping clarify if the conditions used in the experiment lead to different patterns of expression.
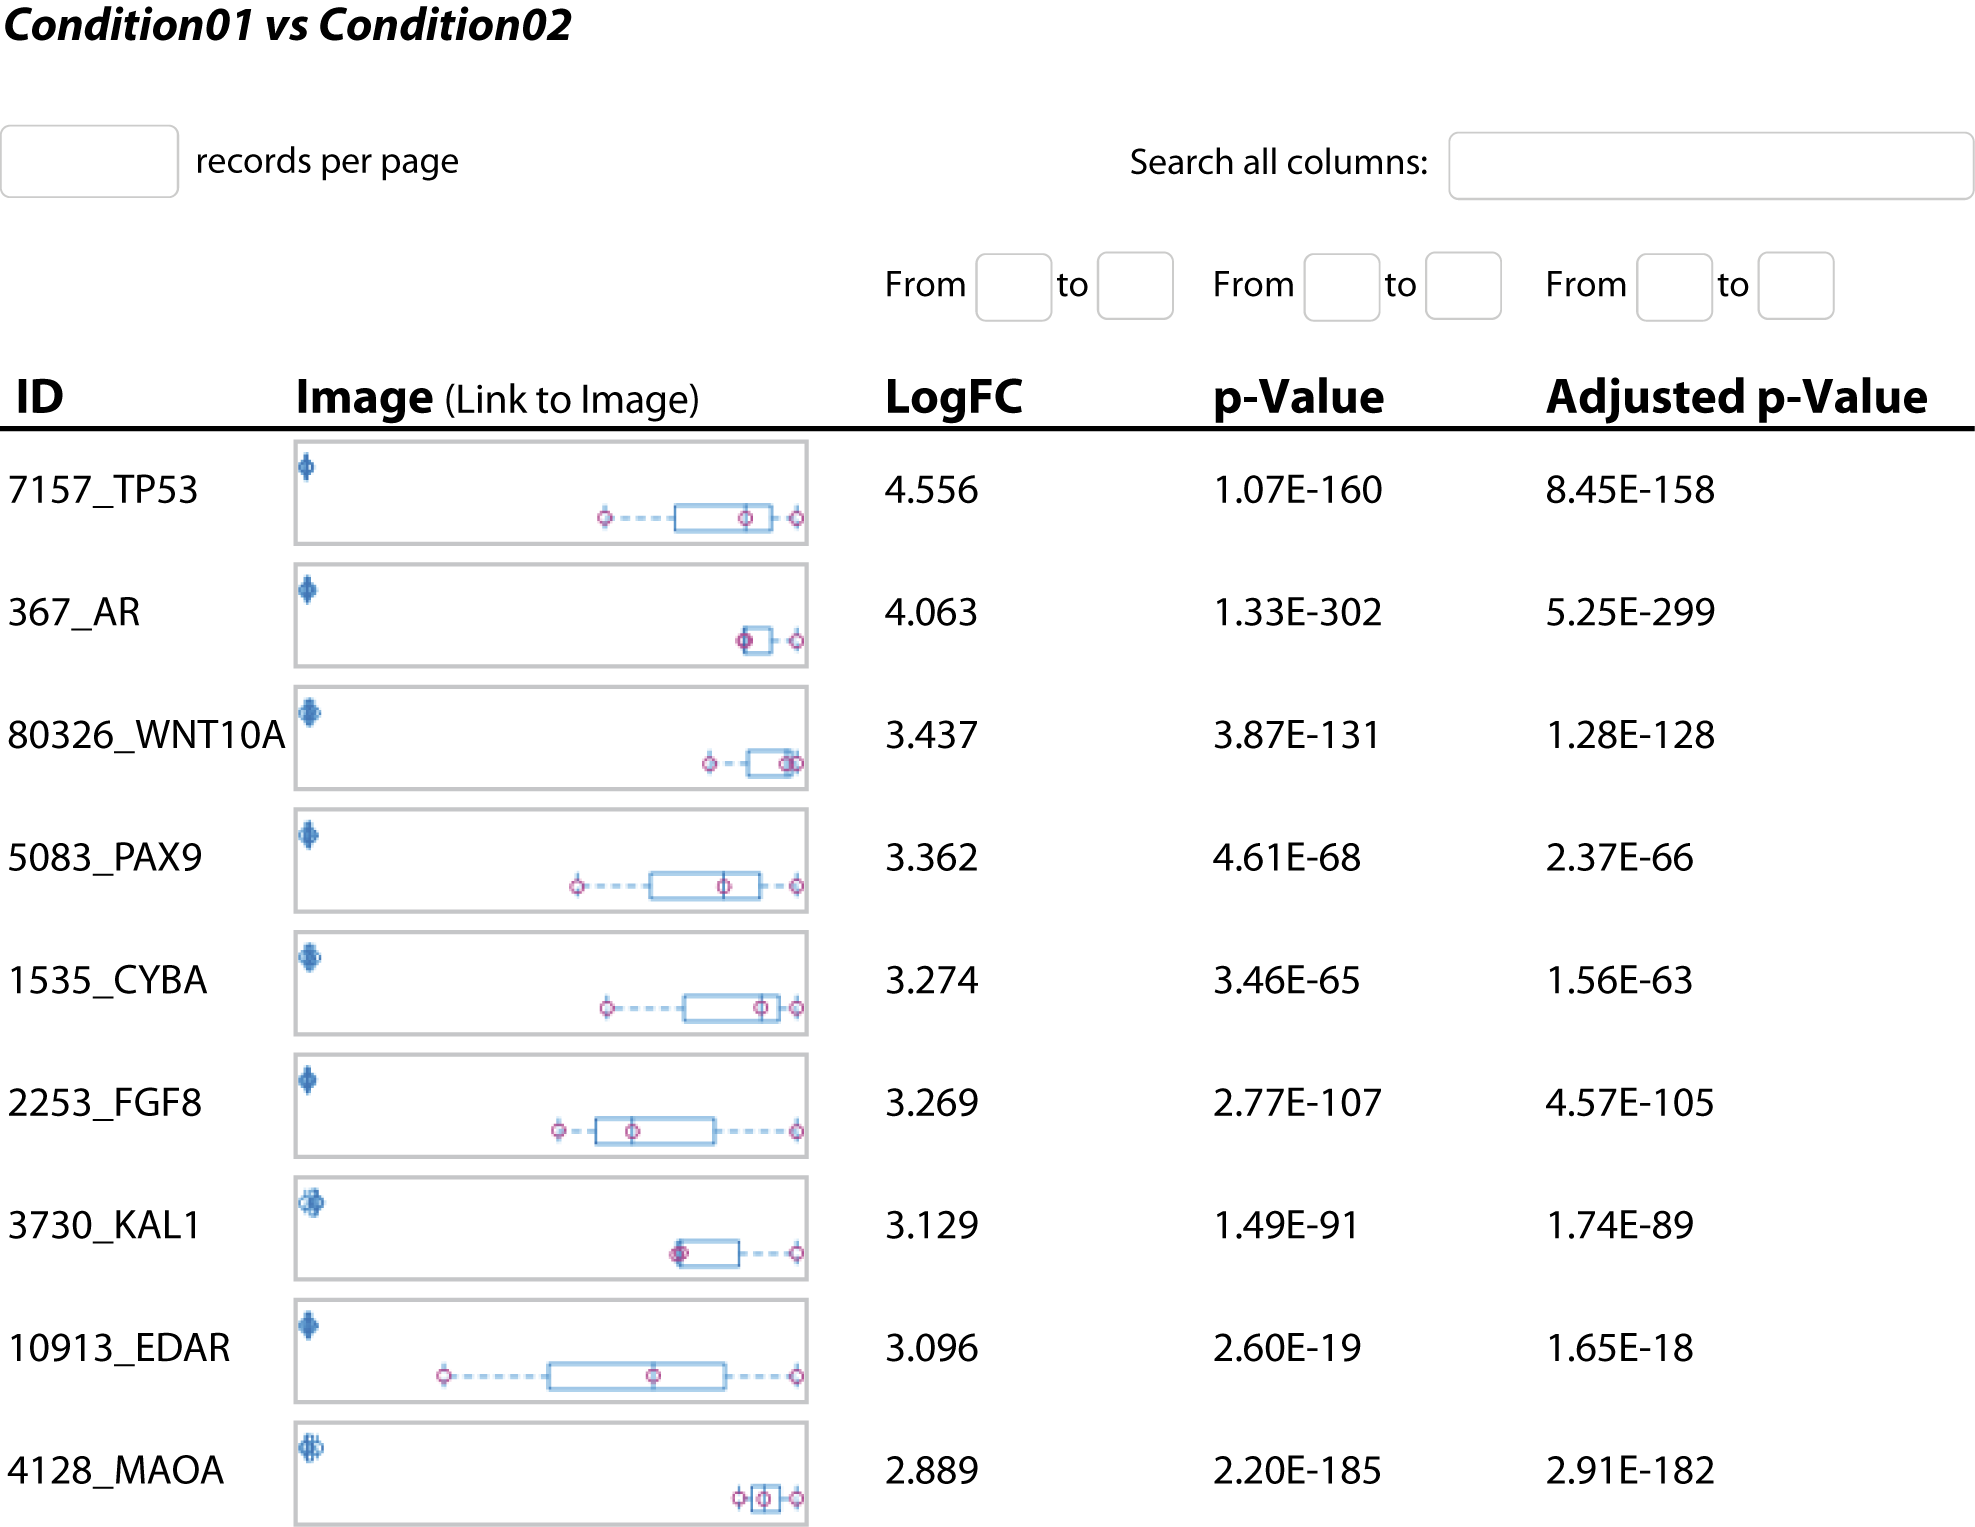
Figure 3: For all measured genes detailed statistics such as log fold change and its significance are listed for further study.

Figure 5: The alternative splicing analysis helps identify the most probable transcript of a gene at the time of the experiment.
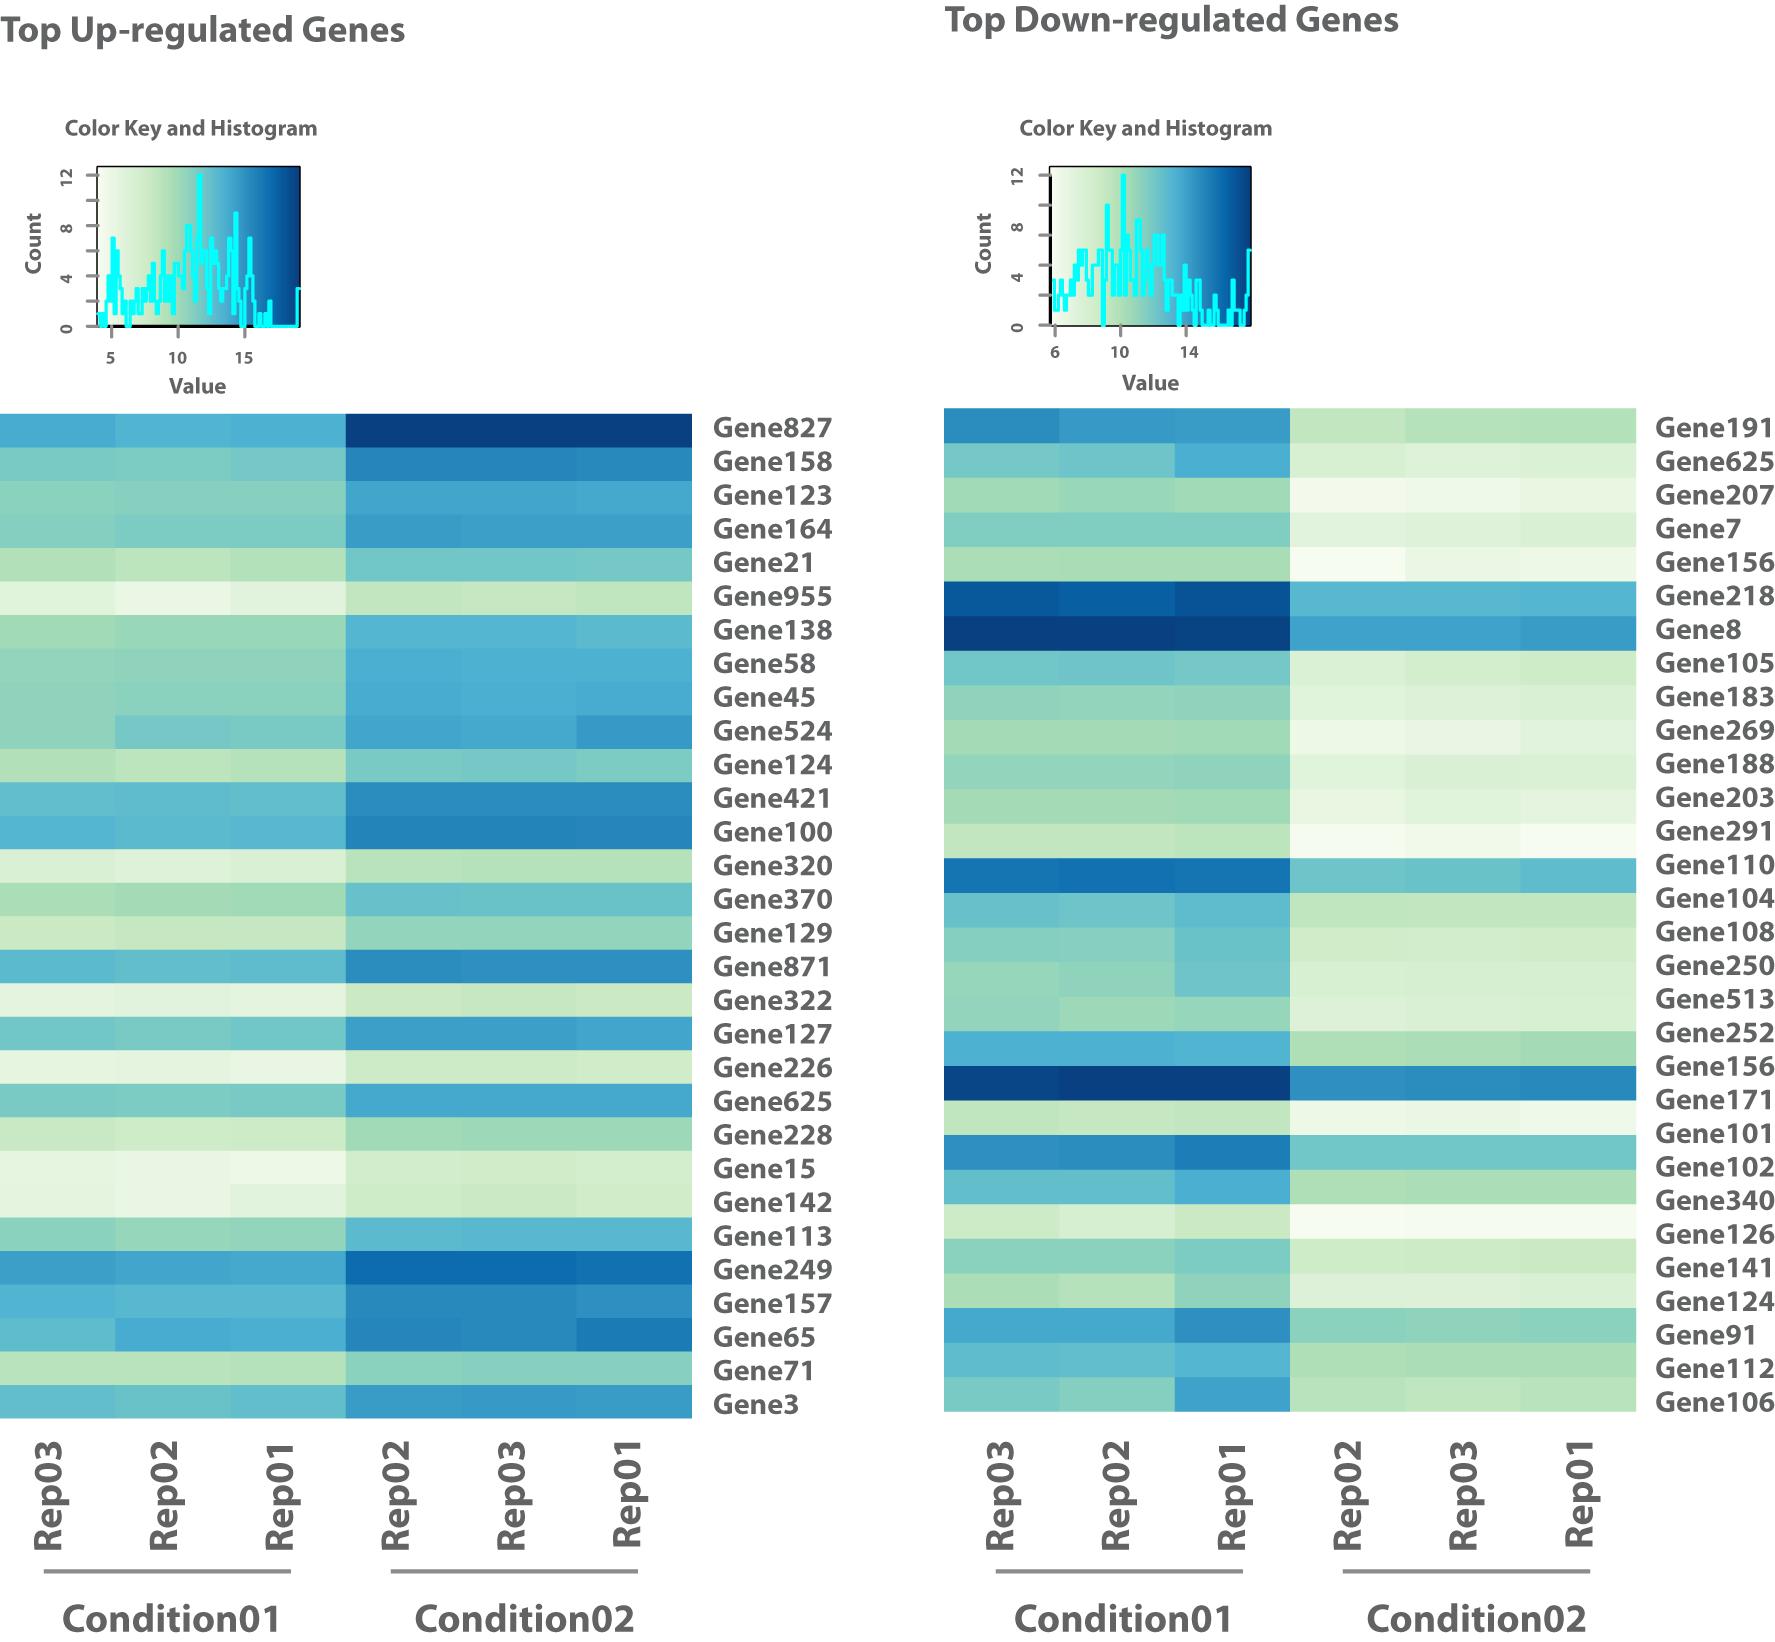
Figure 2: The second heatmap shows the top upregulated and top downregulated genes from a pairwise comparison of two conditions (e.g., stressor vs control).
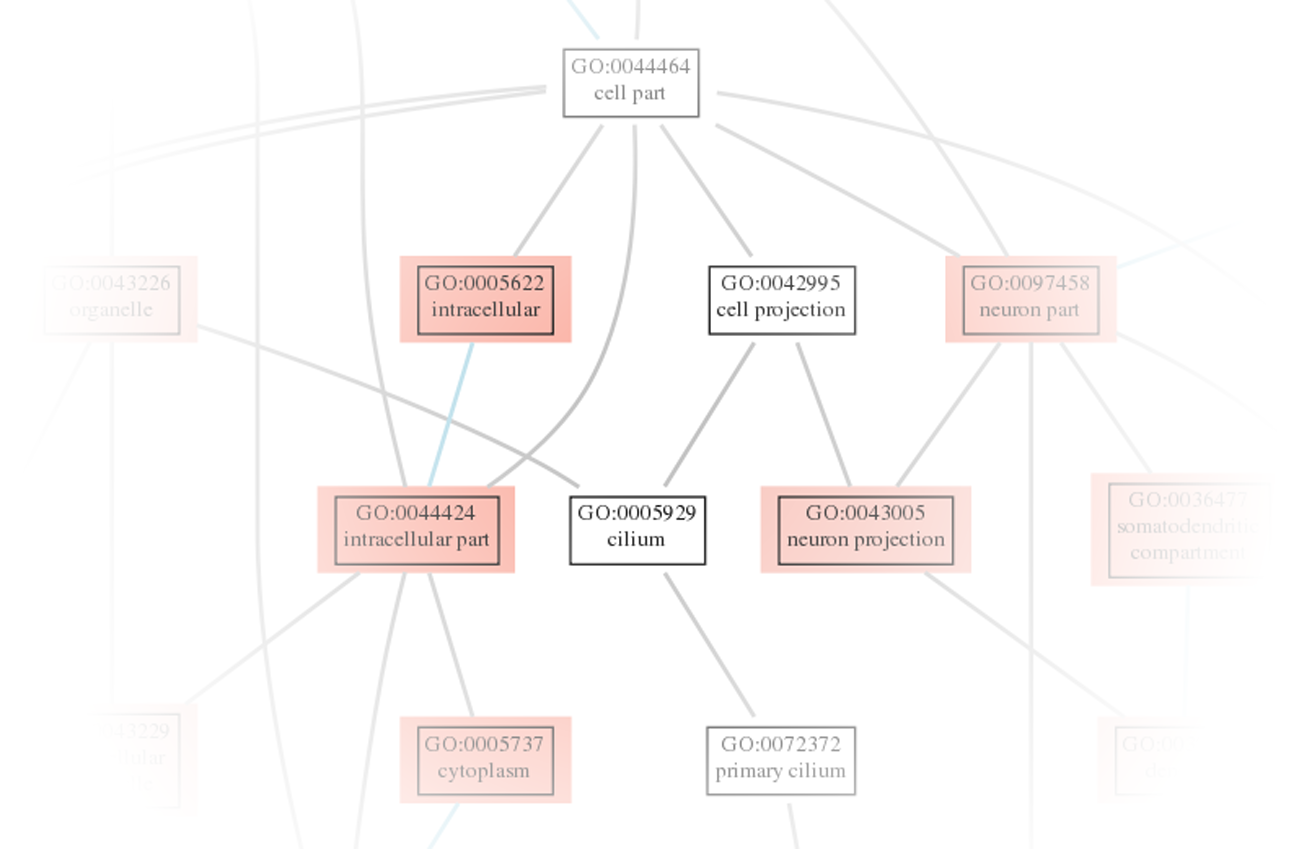
Figure 4: The pathway enrichment analysis helps identify differentially regulated pathways which in turn may explain observed phenotypes.
Turnaround Time
- Delivery of data within 25 working days upon sample receipt (includes library preparation and sequencing)
- Additional 5 working days for data analysis (bioinformatics)
- Express service possible on request