

Back to top
Amplicon Deep Sequencing

Use amplicon deep sequencing to:
- Detect introduced or expected mutations
- Discover rare genomic variations with high confidence
Overview
Considerations before starting an amplicon deep sequencing project:
- Locus-/Amplicon length?
- Expected complexity/Sequencing depth?
- DNA amounts?
Let us guide you – from design to analysis
Example projects using amplicon deep sequencing:
- Taxonomic analysis with specific species focus (Barcode of Life studies)
- CRISPR/Cas and TALEN verifications and screenings
- Species Occurence detection (eDNA)
- High throughput Sanger sequencing alternative for short sequences
Applications related to amplicon deep sequencing:
- 16S/ITS Metagenomics
- CRISPR/Cas Sequencing
- Whole Exome Sequencing
Workflow
A typical workflow for an amplicon deep sequencing project is shown in the graphic below. Please note that our highly-modular processes allow you various entry and opting out options. If you outsource your entire NGS project to Microsynth or only parts of it is up to you.
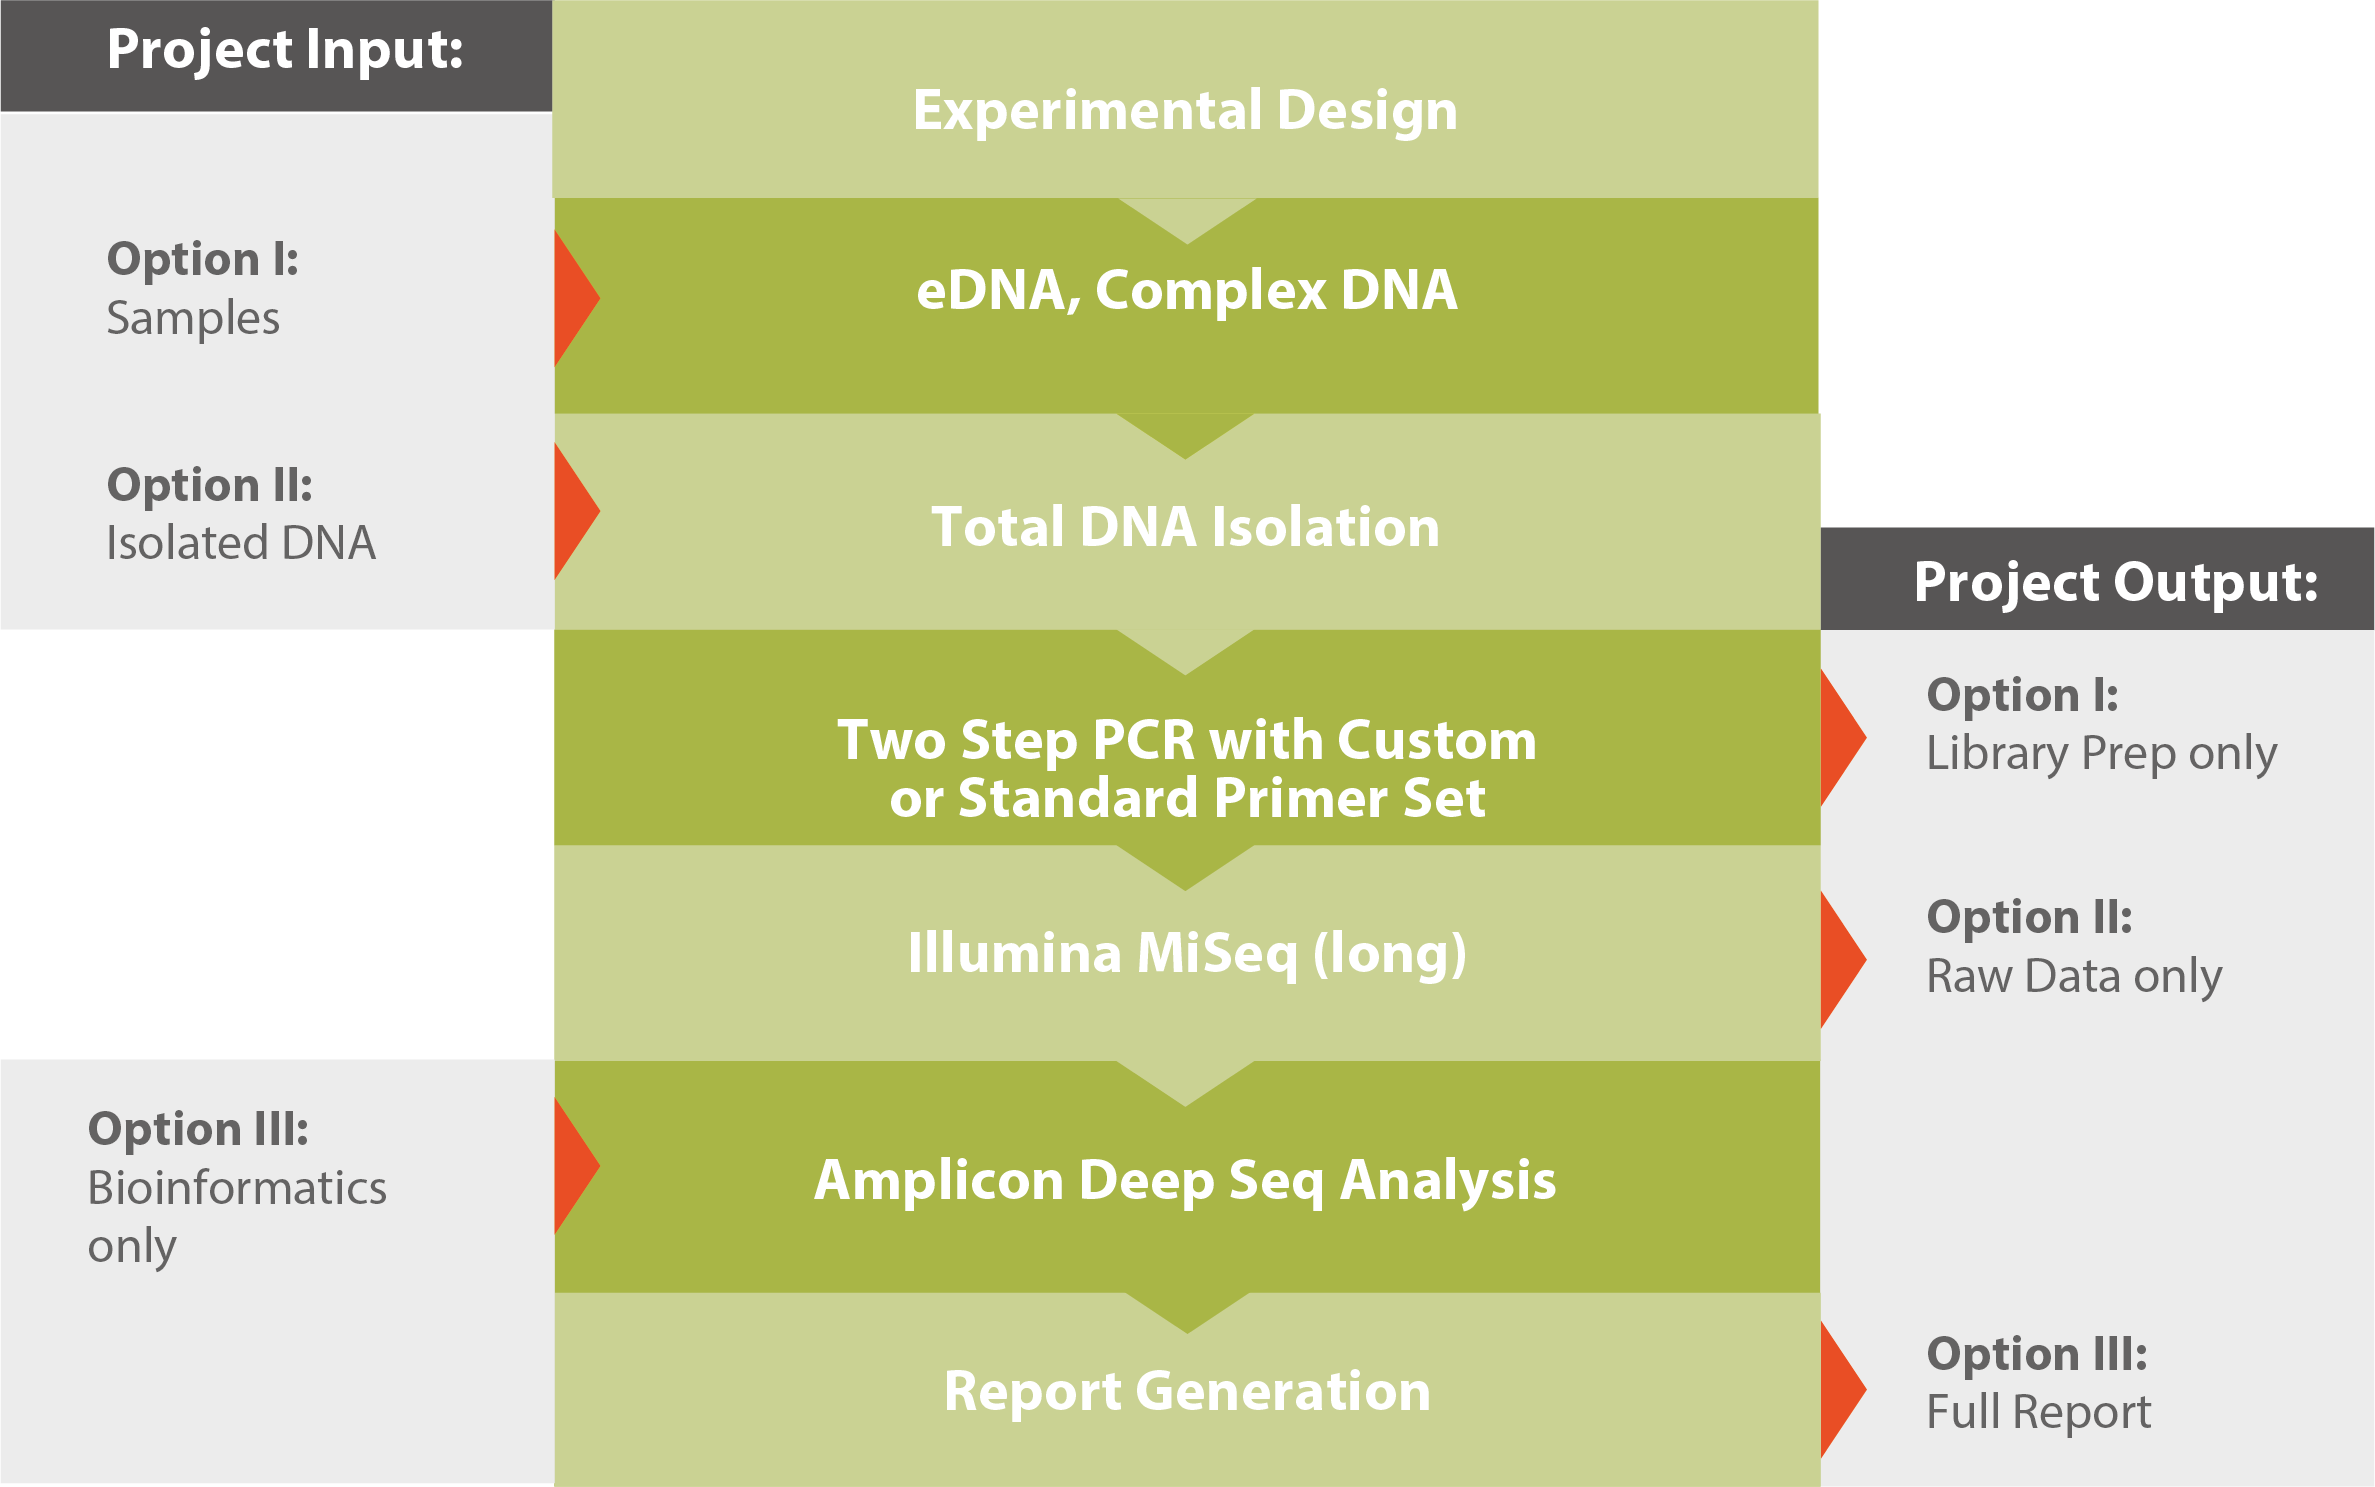
For further reading and a detailed technical description, please download our Application Note Amplicon Deep Sequencing (see related downloads).
Results
The results produced by our analysis module help answer two main questions of sequencing a target region (e.g., a specific gene; input may be amplicons or long range PCRs).
- Which are the single nucleotide variations and small insertions/deletions in comparison to the reference sequence and which are the effects of these detected variations on the protein level? (see Table 1)
- What is the confidence of the detected variations and what are trustworthy thresholds to distinguish noise from putative variations? (see Figure 1 and 2)
- What is the consequence of a certain treatment compared to a group of controls? (complementary comparative dereplication analysis) (see Figure 3)
Table 1: This detail of a results table lists detected variations and their annotation.
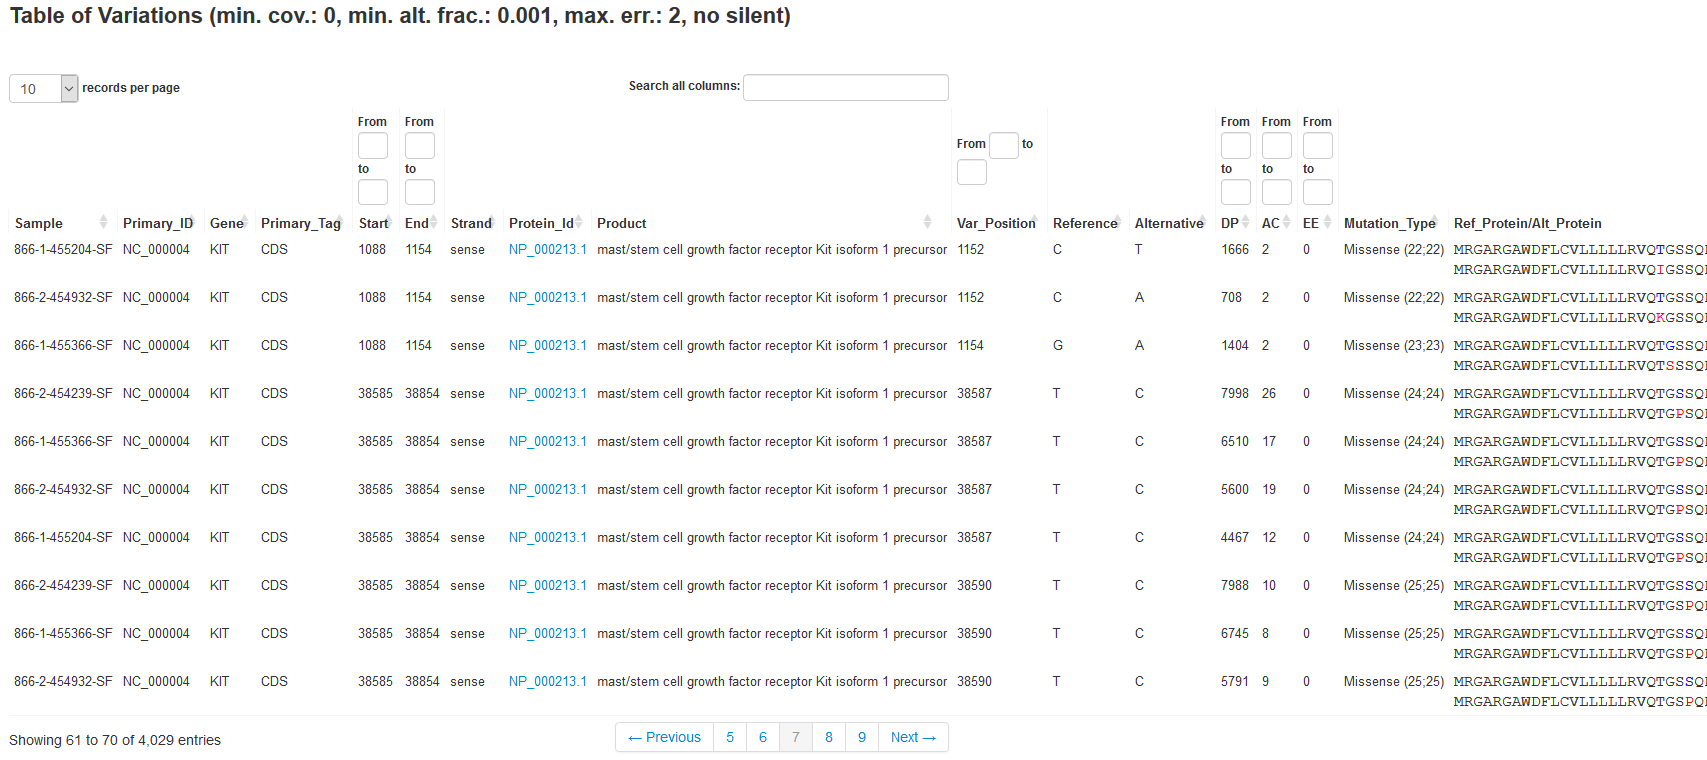

Figure 1: This figure depicts the read coverage of a target region.

Figure 2: This figure shows an analysis of possible thresholds to distinguish noise from putative variations.
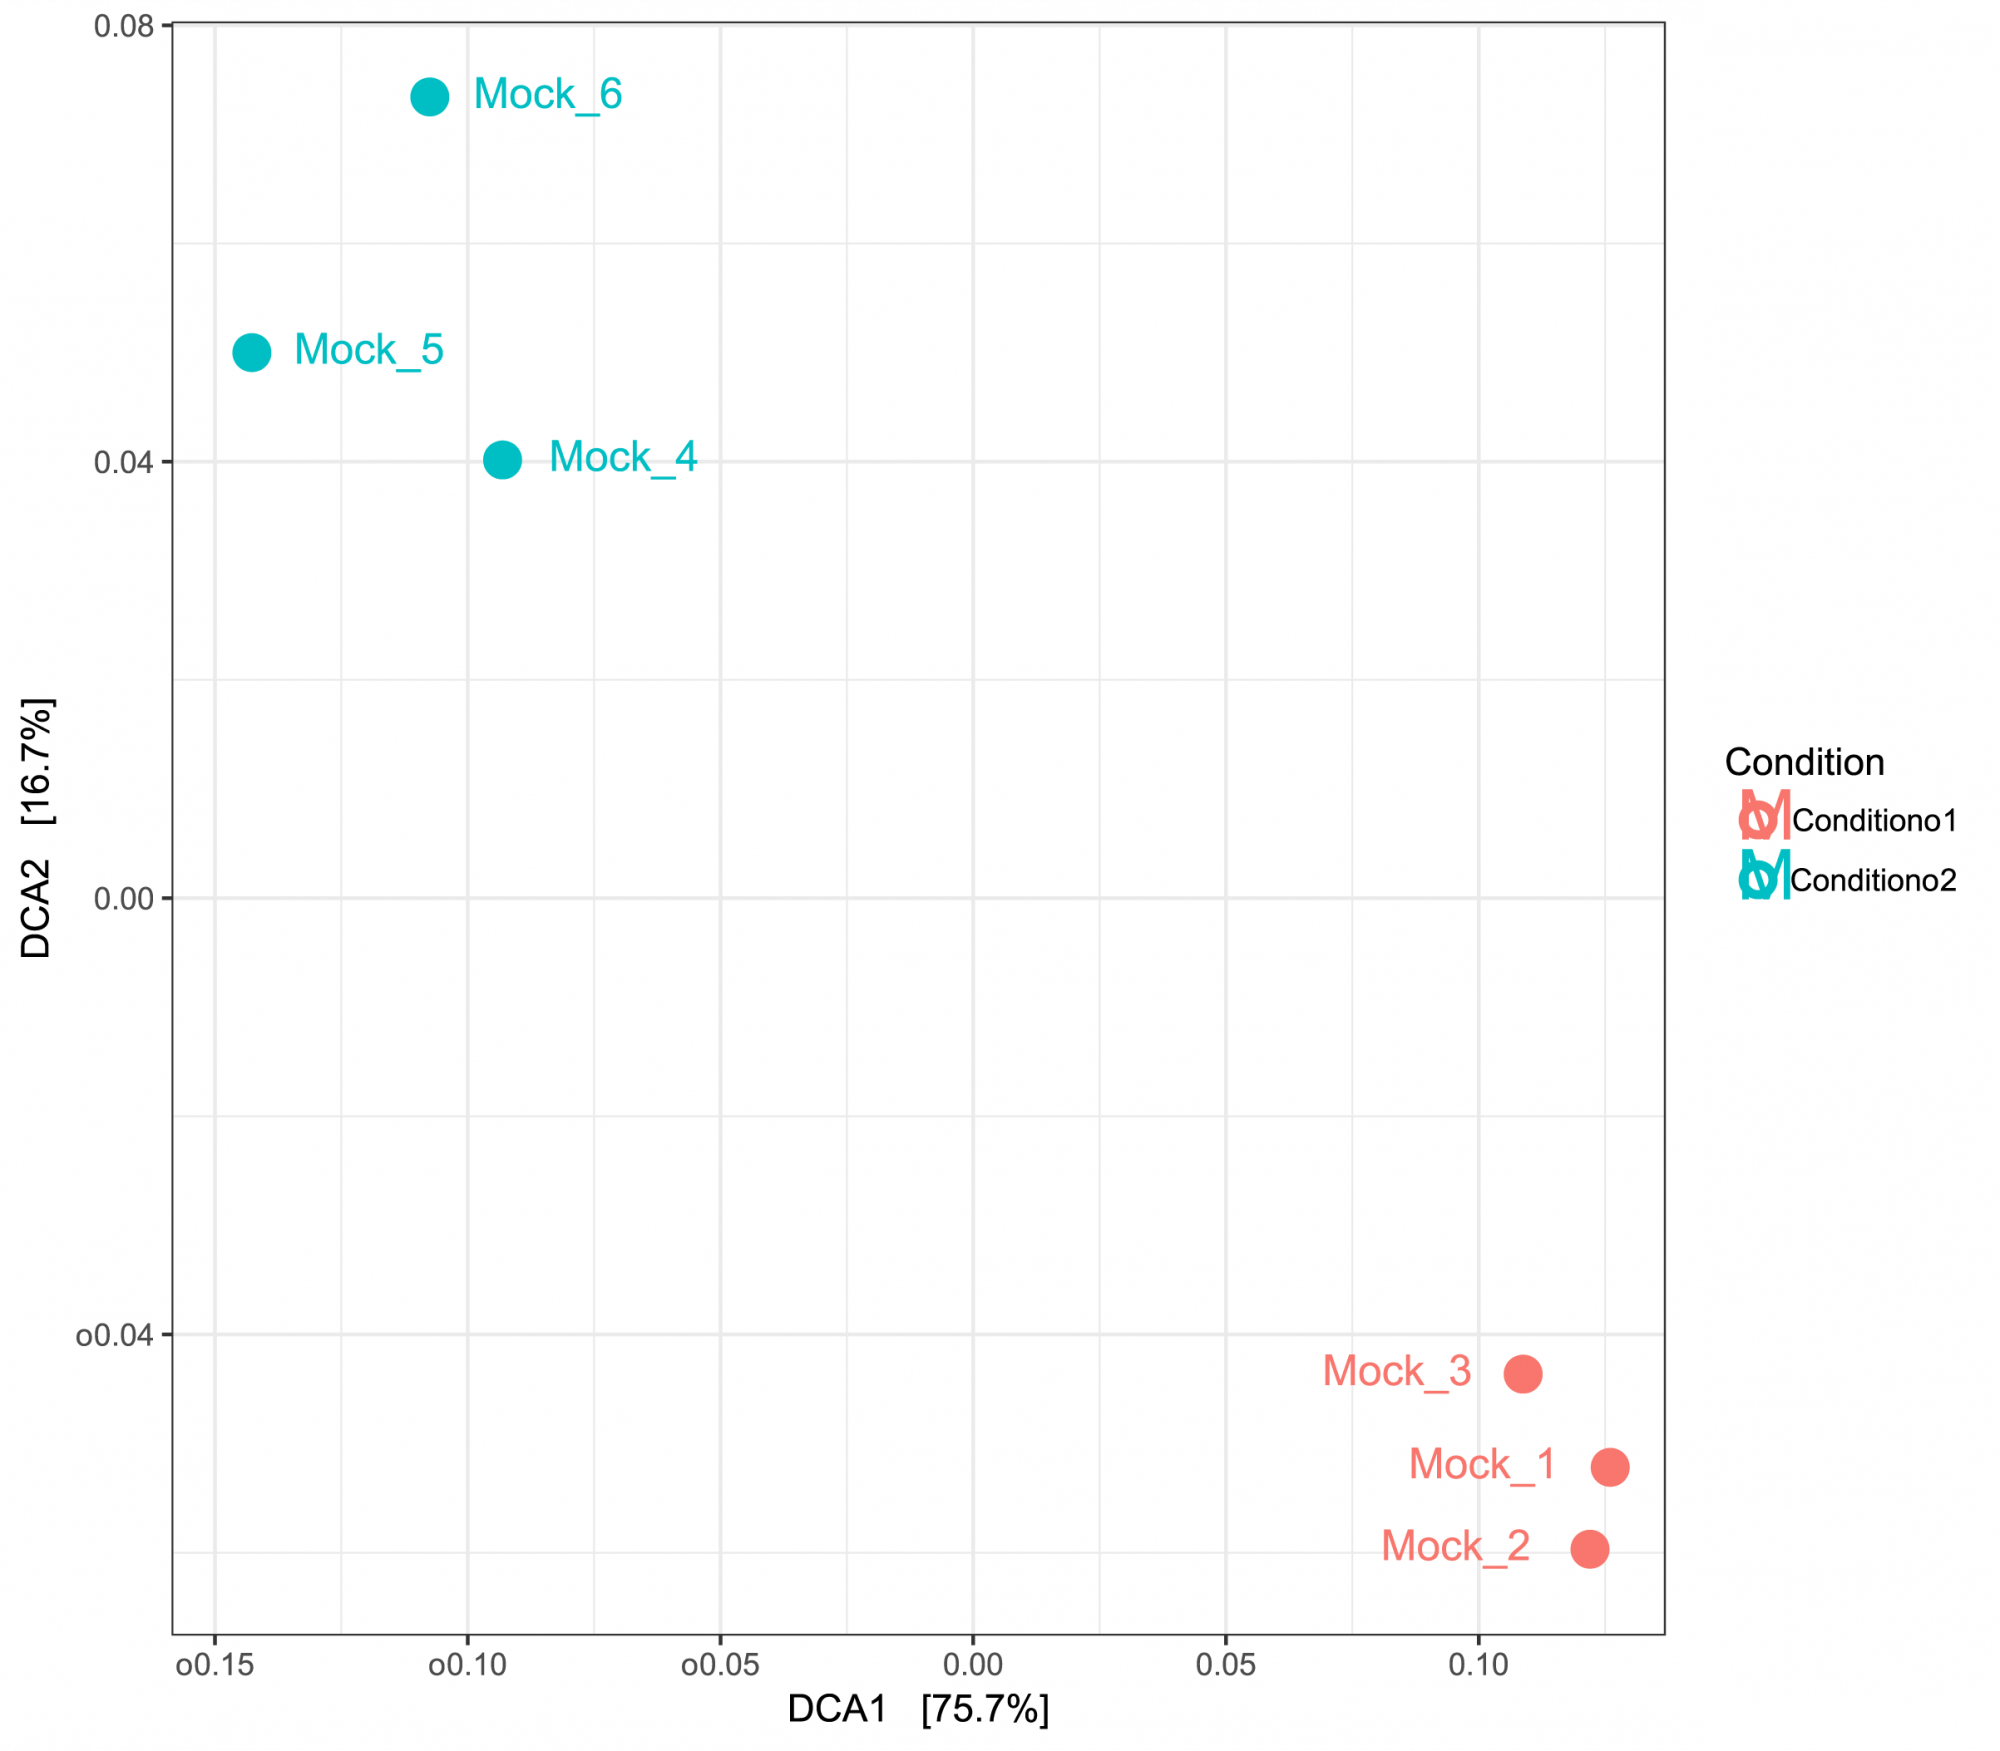
Figure 3: PCA based on frequency of dereplicated sequences per sample and grouped by two conditions.
Turnaround Time
- Delivery of data within 25 working days upon sample receipt (includes library preparation and sequencing)
- Additional 10 working days for data analysis (bioinformatics)
- Express service possible on request