

Back to top
Shotgun Metatranscriptomics

- Study the active genetic composition of your samples
- Get functional insight on bacterial community level
- Discover active transcripts and up- or downregulated pathways
Overview
Considerations before starting a shotgun metatranscriptomics project:
- Sample amounts and origin?
- Adequate sampling technique?
- Sequencing depth (sensitivity)?
- Descriptive and/or empirical study?
- Focus on gene expression, taxomy, functional potential?
- Community complexity and constitution?
Let us guide you – from design to analysis
Example projects using shotgun metatranscriptomics:
- Activated enzyme cascades under bioreactor conditions
- Functional host pathogen regulatory interactions
- Discovery of new enzymatic interactions
- Evolutionary adaptations in microenvironments
- Gene expression analysis of uncultivatable bacterial communities
Applications related to shotgun metatranscriptomics:
- RNA sequencing
- Shotgun metagenomics
- Amplicon metagenomics
Workflow
For further reading and a detailed technical description, please download our Application Note Shotgun Metatranscriptomics (see related downloads).
Results
Shotgun metatranscriptomics analysis is based on RNA extracted from a microbial community. While shotgun metagenomics focuses on the taxonomic composition and functional potential of a community, shotgun metatranscriptomics addresses the part of the community that is actively expressing genes and answers these main questions:
- Which genes in the microbial community are actively expressed? (see Table 1)
- Which taxonomic groups are part of the active microbial community? (see Figure 1)
- Are there differences in the expression of functional genes between communities or conditions? (see Figure 2)
Our analysis module results in a complete overview of the expressed functional genes and the taxonomic composition of the active microbial community. Additionally differentially expressed genes and features can be identified between varying conditions or different communities.
Table 1: Summary table resulting from differential gene expression analysis of the metatranscriptomic dataset. The IDs refer to the InterPro classification for proteins. The column logFC represents the logarithmic fold change between Condition1 and Condition2. Statistical significance is given by the p-value and the adjusted p-value for multiple testing.
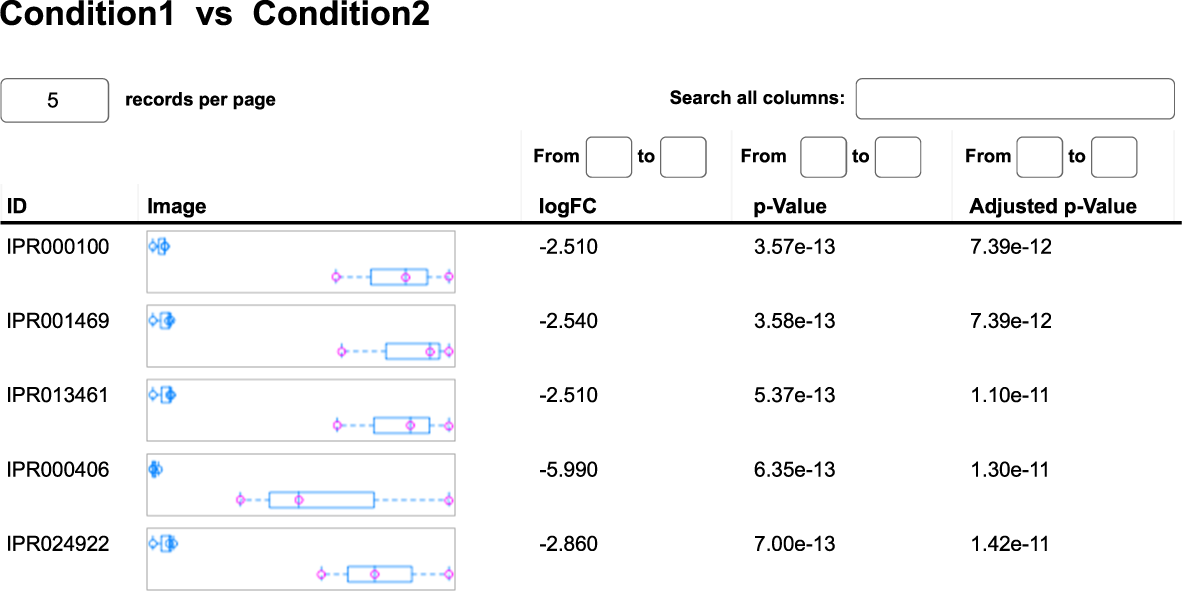

Figure 1: Word cloud representing the bacterial composition of the active community on the phylum level. Size of the words are proportional to the phylum abundance.
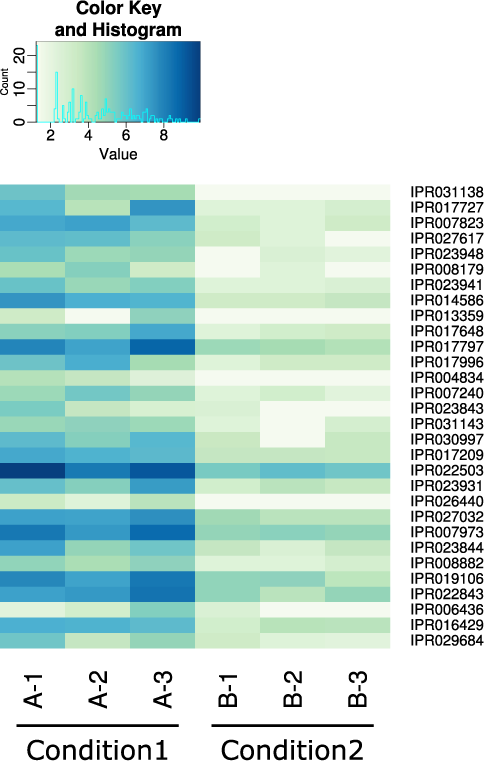
Figure 2: Heatmap of the top 30 upregulated genes between Condition1 and Condition2.
Turnaround Time
- Delivery of data within 30 working days upon sample receipt (includes library preparation and sequencing)
- Additional 10 working days for data analysis (bioinformatics)
- Express service possible on request